Task. The second experiment shows that ALS can use experience to significantly reduce average search time consumed by successive LS calls in cases where there are multiple tasks to solve, and that ALS can be further improved by combining it with EIRA. To be able to run a sufficient number of simulations to obtain statistically significant results, we replace the big maze from Figure 1 by the smaller maze from Figure 2, which indicates 10 different goal positions. At a given time, only one of the goal positions contains ``food''. But the agent does not know which! Whenever the agent finds food, it takes it home to eat it. Next time, food appears in another location. Therefore, there is no deterministic program that always can generate a shortest path. The best the agent can do is to learn a stochastic policy minimizing expected search time.
One experiment consists of 10 simulations.
For each simulation, 10 goal positions are randomly generated.
Each simulation consists of 100 ``epochs'', where
each epoch consists of 10 ``runs'', where during
the ![]() -th run the
-th run the ![]() -th goal position has to be found
(starting from the start state).
-th goal position has to be found
(starting from the start state).
![]() ,
, ![]() and
and ![]() are adjusted
whenever a solution is found.
are adjusted
whenever a solution is found.
Comparison.
We compared (1) Random Search, (2) ALS
and (3) the ALS+EIRA combination, where
EIRA restores old policies if necessary, always
right before ALS' matrices are adapted.
For the LS calls triggered during ALS' runtime,
we set ![]() to 0.02.
ALS performed best with a learning rate
to 0.02.
ALS performed best with a learning rate ![]() = 0.05.
ALS+EIRA performed best with a learning rate of 0.08.
= 0.05.
ALS+EIRA performed best with a learning rate of 0.08.
Results.
All methods always found all 10 goal positions before running
into the time-limit (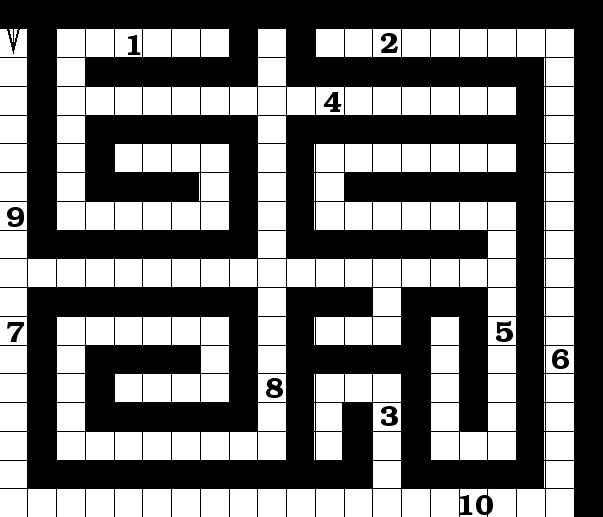 steps for each goal).
The learning curves are given in figure 3. In the
beginning, the LS calls triggered by ALS take a
long time, but after a few epochs
the search cost improves by a factor of about 100 (for scaling
reasons, Figure 3 does not even show the initial search costs).
Table 1 shows the average number of
steps required to find all 10 goal positions in the
steps for each goal).
The learning curves are given in figure 3. In the
beginning, the LS calls triggered by ALS take a
long time, but after a few epochs
the search cost improves by a factor of about 100 (for scaling
reasons, Figure 3 does not even show the initial search costs).
Table 1 shows the average number of
steps required to find all 10 goal positions in the ![]() epoch of the 10 simulations. The results show (1) that ALS
finds the 10 goal positions on average much
faster than random search.
The table also shows (2) that the use of EIRA
significantly further improves the results (the additional
speed-up factor exceeds 2.0).
epoch of the 10 simulations. The results show (1) that ALS
finds the 10 goal positions on average much
faster than random search.
The table also shows (2) that the use of EIRA
significantly further improves the results (the additional
speed-up factor exceeds 2.0).
The safety belt effect. Figure 4 plots number of epochs against the average probability of programs computing solutions. The figure shows that ALS+EIRA tends to keep the probabilities lower than ALS by itself: high program probabilities are not always beneficial.
| Method | Average | SD | MAX | MIN |
| ALS + EIRA | 7.5 | 3.7 | 12.5 | 3.3 |
| ALS | 19.2 | 17.3 | 65.5 | 4.6 |
| RS | 168 | 284 | 1005 | 10.2 |
Effectively, EIRA is controlling the prior on
the search space such that overall average search time is reduced.
The total stack size
(the number of instruction probability vectors on the stack) after the
![]() trial was 108 on average.
Since the total amount of
policy modifications is (number of goal positions) * (number of epochs)
* (average solution length) = 3800,
EIRA kept only about 3% of all modifications!
The remaining 97% were deemed unworthy, because they
were not observed to be followed by long-term reinforcement speed-ups.
Clearly, EIRA prevents ALS from overdoing its policy
modifications (``safety belt effect'').
trial was 108 on average.
Since the total amount of
policy modifications is (number of goal positions) * (number of epochs)
* (average solution length) = 3800,
EIRA kept only about 3% of all modifications!
The remaining 97% were deemed unworthy, because they
were not observed to be followed by long-term reinforcement speed-ups.
Clearly, EIRA prevents ALS from overdoing its policy
modifications (``safety belt effect'').